The Research Week · October 26 to 30, 2026
This week's research kept circling one habit: people want a second look before they commit. Shoppers are rereading their holiday lists as confidence slides across 30 countries. Patients want a human to check what AI decides. And the people who run surveys are being told, by the head of one of the field's most respected institutions, to check twice whether their respondents are real. The "three checks" are my way of reading the week; each section stays inside what its own numbers support.
This issue draws on new releases from Ipsos, Pew Research Center, YouGov, Circana and NIQ, alongside Research Live's reporting on the insights industry and signals from J.D. Power, Angus Reid, Gallup and Statistics Canada.
Check one: the budget gets a second read

Last week's wobble is this week's slide. The Ipsos Global Consumer Confidence Index, out October 27, dropped 1.1 points to 47.3 and now sits below where it stood a year ago. Eleven of 30 economies fell by a notable margin. Two rose. The United States did the heavy lifting on the way down, shedding 5.3 points to its weakest reading since October 2011, as Americans turned sharply less comfortable with big-ticket and household purchases. Britain and France each lost 2.9 points. (The flag went up in last week's issue; this is the confirmation.)
Three of four sub-indices fell this month; only jobs held
Index scores on a 0 to 100 scale. Red marks a notable monthly decline. Source: Ipsos Global Advisor, more than 21,000 adults under 75 in 30 countries, September 25 to October 9, 2026.
In the US, the pump is doing some of the damage. A Pew short read published October 30 finds 74% of Americans very concerned about gas and energy prices, up from 60% in July and 43% in January. Regular gas sat at $4.12 a gallon on October 26, 47.4% above its February level. That explains some of the American mood. It does not explain a move across 30 economies, and the Ipsos release does not try to.
So are shoppers retreating? Not on the evidence so far. They are editing. An Ipsos poll for Thrivent found about two in three Americans plan to cut back in at least one holiday category, whether dining out, gifts or travel. That share is exactly where it was in 2025. What moved is the shopping list: some now plan fewer gifts, or fewer people to buy them for, and nearly four in ten say the holiday budget worries them more than it used to. One caveat that matters: these are plans. Nobody has rung up a sale yet.
Why it matters. A headline that reads "same as last year" can sit on top of a very different basket. If your holiday tracker stops at a single cutting-back flag, you will miss the story. Ask where the cuts land, then come back in January and check what people actually spent.
Check two: fine, let the machine do it. Then show me a human.

The week's richest dataset came from Pew's report on AI in healthcare, published October 29 from June fieldwork. The pattern is consistent and a little humbling for anyone selling automation. Ask Americans whether AI should take the notes in a doctor's appointment and 56% say yes, as long as a person reviews them. Only 13% would let the AI handle it alone. Move up the stakes to an insurance claim and the room cools fast: 46% want AI nowhere near the decision, 38% would accept it with a human final review, and 5% would let the algorithm rule unsupervised. Diagnosis lands in nearly the same place. And when the question turns personal, 60% say they would be uncomfortable if their own doctor leaned on AI for diagnosis and treatment, double the 30% who would be at ease.
Openness falls as the stakes rise, and review is the preferred mode at every level
Percent of US adults. Bars do not sum to 100 because other responses are not shown. AI alone: 3% for diagnosis, 5% for claims. Four of the eight tasks Pew asked about are shown. Source: Pew Research Center, American Trends Panel, 3,488 US adults, June 22 to 28, 2026.
Who you are shapes what you expect. More than half of upper-income adults (55%) think AI will make patients healthier. Among lower-income adults, a quarter agree and 41% expect the opposite. On the relationship between patient and doctor, the verdict is lopsided: 47% expect AI to make it worse, 10% better.
A related, if not identical, signal came from YouGov's study of charitable giving: 38% say AI-generated content would put them off donating, ranking behind distrust of the charity (52%) and feeling pressured (48%). Read that as a reaction to authenticity as much as a demand for oversight. It rhymes with the Pew finding; it is not the same finding.
The industry is already building the reviewer into the product. Circana's new agent programme with Ode scores each agent against expert-verified cases and hands anything uncertain to a human specialist. That is a design choice worth noting, and nothing more yet: no outcome data has been published.
Why it matters. Acceptance is task by task, and where people accept AI at all they mostly want a person to sign the bottom of the page. What nobody has measured, Pew included, is how much that visible signature moves trust and satisfaction. Run the test before you design the human in or out.
Check three: is anyone actually there?
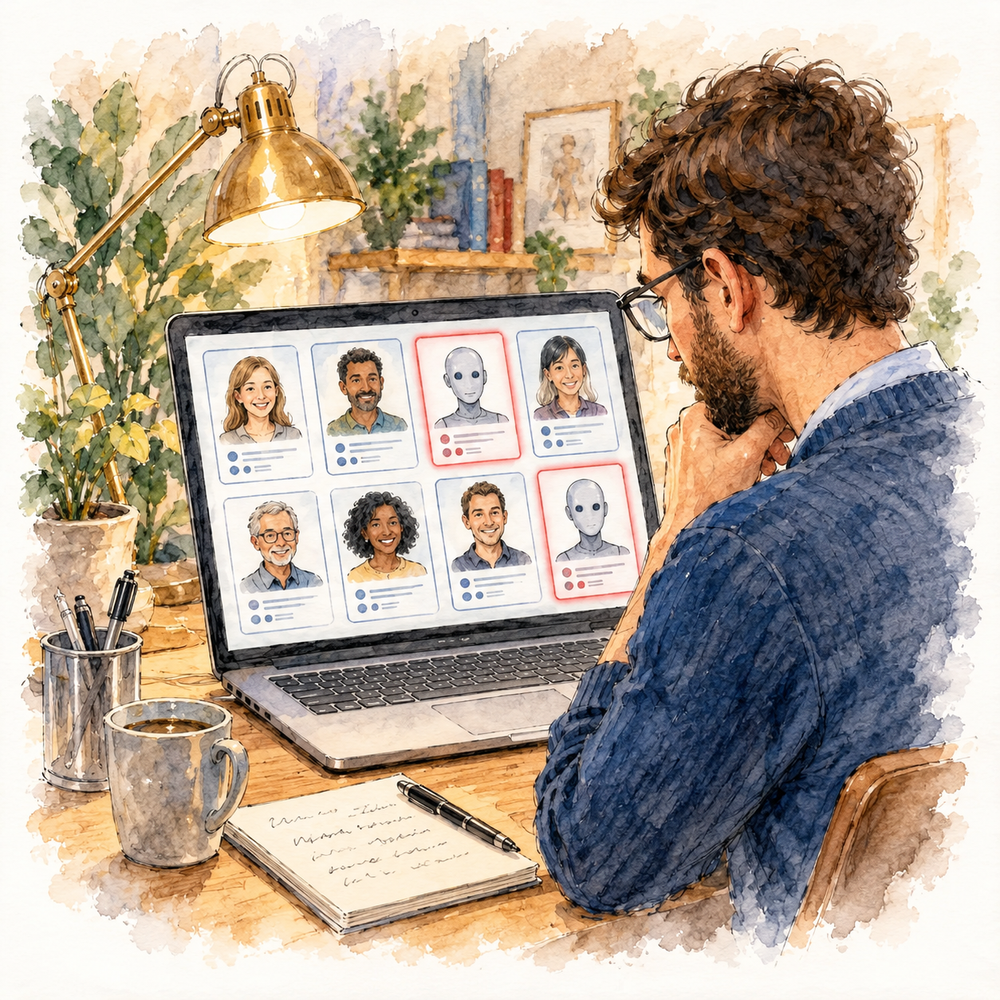
The third check points at our own instruments. In a commentary republished October 29, Pew president Michael Dimock listed what is eroding opinion research this cycle: a flood of cheap opt-in polls with methods nobody can inspect, bogus respondents ranging from AI-driven bot farms to people gaming surveys for the payout, "synthetic" surveys that let a model answer instead of a person, and a few polls that were simply made up. The damage is not evenly spread. Dimock singles out estimates for Hispanic adults and young people as the ones most distorted. His frame is the US midterms. The problems are not.
The industry's response this week touched three different problems, and the news reads better if you keep them apart.
- Fraud: are these answers real and eligible? The Logit Group and Data Quality Co-op are wiring shared, respondent-level quality signals into Logit's Calibr8 fraud platform.
- Over-cleaning: are we throwing out real people? At an MRS webinar, speakers from NIQ, MRS, Quest Mindshare and CRIC warned that straight-lining alone should never trigger removal, and that one flag never tells the whole story.
- Synthetic: can a modelled answer stand in for a real one here? Vectorial raised $3 million for modelled audiences. Money is not validation; no accuracy data was reported. Synthetic respondents also surfaced in last week's issue, so count this as a recurring signal rather than a one-off.
Why it matters. The live tension is between the first two. Clean too little and the bots vote. Clean too much and you evict real respondents, and Dimock's point is that the eviction hits hardest in the subgroups whose estimates already rest on thin samples. Synthetic data is a separate question with its own burden of proof.
A note on method: read the fine print on the index and the panel
Three details worth carrying into your next report. First, Ipsos builds its global index as a plain average of national indices, so Luxembourg counts the same as the United States. A sharp American drop moves the global figure no more than an equal drop in a much smaller market. Second, several Canadian releases this week, Angus Reid among them, run on online panels and say so: the margin of error they quote describes a probability sample of the same size, not the panel itself. If you repeat the number, repeat the disclaimer, and say plainly that it does not measure the panel estimate's uncertainty. Third, watch the dates. Pew's AI report landed this week but was fielded in June; it describes early-summer opinion, not this week's.
Also worth knowing
- Gallup: US employee engagement fell to 29% in Q3, its lowest since 2011, with the sharpest declines among remote and hybrid workers at organizations that have adopted AI (October 28).
- J.D. Power: US small business banking satisfaction rose 10 points to 726, its fifth straight annual gain, but satisfaction with relationship managers fell 15 points, and 35 points among customers of two years or less, echoing the digital up, human down gap in last week's Canadian banking study (October 27; 6,974 small business decision makers, May to August 2026).
- Statistics Canada: payroll employment fell 49,600 in August after a 15,700 decline in July (October 29).
- Angus Reid: 78% of Canadian NHL followers say more games needing extra subscriptions is a bad trend; 71% of DAZN subscribers call it too expensive (October 29).
Reading these numbers together
Different countries, different sponsors, different samples, different modes: a 30-country online tracker, US probability panels, an opt-in Canadian panel and a commentary with no new data at all. Put the figures side by side and you are comparing apples to a fruit bowl. The "three checks" are my shelf for them, not a finding they share.
What each one does hand you is a next step. On spending, track where the planned cuts land by category, then reconcile against actual spend. On AI, test the service with and without a visible human review step and report the gap by task and by income. On data quality, write fraud thresholds into supplier contracts and audit what your cleaning rules remove, not just what they let through. Three questions worth a second look. That was the week.
Sources
- Ipsos, October 2026: Global consumer confidence falls sharply (October 27, 2026)
- Pew Research Center, Gas Prices Are High Now, but for Many Americans They Were Even Higher in the Past (October 30, 2026)
- Ipsos, Two in three Americans plan holiday cutbacks amid economic concerns (October 28, 2026)
- Pew Research Center, Americans Are Open to AI in Healthcare, but Want Humans Making Final Calls (October 29, 2026; fieldwork June 22 to 28, 2026)
- YouGov, Charitable giving in the U.S.: What motivates donations and what discourages them? (October 26, 2026)
- Circana, Circana puts AI to work, engages Ode with Anthropic (October 29, 2026)
- Pew Research Center, The 2026 Midterms Will Be Uniquely Difficult for Polls (October 29, 2026)
- Research Live, Data Quality Co-op and Logit partner on survey fraud (October 26, 2026)
- Research Live, Rounded picture needed for survey quality (October 27, 2026)
- Research Live, Vectorial completes funding round (October 26, 2026)
- Angus Reid Institute, Canadians growing weary of switch to streaming for NHL coverage (October 29, 2026)
- Gallup, U.S. Employee Engagement Below 30% for First Time in 15 Years (October 28, 2026)
- Statistics Canada, The Daily: payroll employment and job vacancies, August 2026 (October 29, 2026)
- J.D. Power, 2026 U.S. Small Business Banking Satisfaction Study (October 27, 2026)
